Recreate the Block Diagram below:
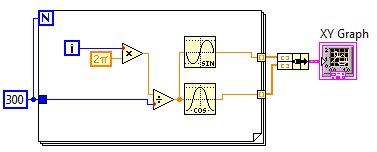
- What figure will be created by the block diagram?
- Change the block diagram to produce a spiral
- (Hint: the Sine/Cosine signals must be getting bigger continously)
- Divide the 300 with a constant on the wire from the loop tunnel to the divide function.
- Try changing the constant to different values.
- What purpose does it serve?
- Change the display to update live
- Move the XY-graph and bundle function into the loop.
- You can no longer use auto-indexing - what do you need to replace it with?
- To do this, you need to use prior knowledge:
What did the auto-indexing do before you moved the XY graph inside the loop? - This "something" must be initialized and the values have to be available from iteration to iteration
- To do this, you need to use prior knowledge:
- Lock the axes to show ±300 (or what you have in the number of iterations in the for loop)
- Disable autoscale x+y
- Insert a delay inside the loop - set it to 15 ms
- You have only been presented for Waveform charts, graphs and XY-graphs. Labview contains many other graphs. One of these is the "Feather plot" (Modern -> Graphs -> Feather).
- Try to add a feather to the front panel, and move the icon inside the loop on the Block Diagram
- With the graph, a "Plot helper" is added.
- You have to wire the X and Y values to this function (use the sine/cosine output). However, you will need to convert these to arrays first - use the Build Array function for this.
- Save your VI as XYgraphs.vi