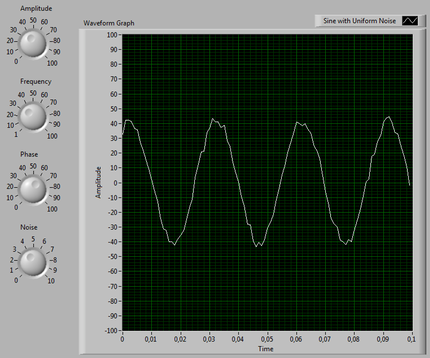
Recreate the Front Panel below
Edit the Block Diagram:
- Simulate signal
- Express->Input->Simulate Signal
- Swith on "Add noise"
- Default values are OK
- Expand Simulate Signal maximally (mark and drag the bottom blue expand box)
- Connect the knobs with Amplitude, Frequency, Phase og Noise and adjust min/max values
- Connect it all and run your VI continually
- Turn the knobs:)
- Add a filter express VI
- Express->Signal Analysis->Filter
- Choose "Lowpass"
- Default values are OK
- Also expand this filter maximally
- Connect another knob with "Lower Cut-Off"
- Merge the two signals (raw + filtered) using a "Merge Signals" and set this as the input to the graph.
- Expand the legend to contain both curves (top right corner)
- Save your VI as WaveformGraphs.vi