Introduction:
In this exercise, you will load the saved ECG data and tonometry measurements and analyze them. In broad strokes the analysis consists of finding the peaks on the ECG and on the pressure curve. The time between the peaks combined with the distance from fossa jugularis and the measurement spot can be used to calculate Pulse Wave Velocity.
VI implementation:
- Make a VI that reads your saved file. Remember to use a "Split Signals" function to separate ECG and pressure
- You may notice noise - try wiring graphs before and after the application of lowpass filters to find a suitable cutoff frequency
- Further, you may notice "Baseline drift" - the signal will go up and down depending on your applied pressure. Unless you're extremely good at maintaining a constant pressure this fenomenon will be present - this is also common in ECG signals (more on this here). To suppress this behavior, you can use a highpass filter. Try inserting graphs after applying an additional highpass filter.
 You can combine the low- and highpass filters into one using a bandpass filter - try doing so.
- You may have distortion at the beginning of the data due to the applied filters. You can eliminate these using an "Extract Portion of Signal" VI, set to begin after the distortion containing the remaining samples
- Delete all the graphs apart from the final filtered one.
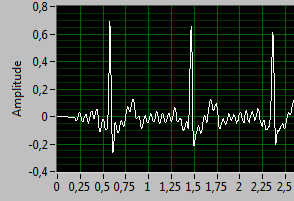
- Find a level on both the ECG and Pressure signals, which can be used for detecting the peaks - on the image to the right, this could e.g. be 0,4
You will now perform the peak detection, the results of which must be plotted and processed. The implemention is very similar to the Step Response exercise, in fact, a portion of this VI will be reused in the form of a SubVI.
- When you did the Step Response exercise, you created code,which generated "artificial" X-data consisting of numbers from 1 to the number of samples, which, using a Bundle Array function, was combined with the Y-data. This enabled the display of both the signal as well as peaks and valleys in the same graph. These functions will be reused here:
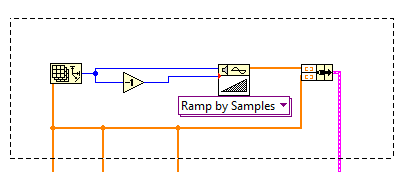 Open 4-2_StepResponseAnalysis.vi
- Mark the functions to the right:
- Choose Edit -> Create SubVI
- Change the icon and wiring pattern
- Save your SubVI as XY-data_SubVI.vi
- Insert your SubVI in the PVW VI you are currently creating
- Insert a "Convert From Dynamic Data function
- Express -> Signal Manipulation -> Convert From Dynamic Data
- Choose 1D array of scalars - automatic and press OK
- Connect the output from "Extract Portion of Signal" to the conversion function and the output from this to your SubVI
- Insert a "Peak Detector" VI
- Signal Processing -> Signal Operation -> Peak Detector
- Insert a suitable threshold - the same as previously determined
- Insert an indicator array on the output and rename it "Pressue Peaks". Expand it on the front panel, to include all the detected peaks
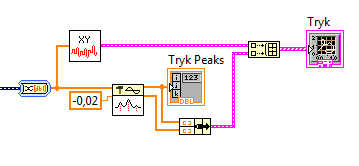 Indsæt en "Bundle" funktion
- Programming -> Cluster, Class & Variant -> Bundle
- Forbind indgangene med Locations og Amplitudes fra Peak Detektoren.
- Insert a "Build Array" function og samle clustret fra bundle funktionen samt jeres Sub-VI heri.
- Forbind udgangen med en XY-graf, kald den Tryk
- I skulle nu have noget som ligner Block Diagrammet th:
- Kopier hele denne blok til EKG signalet
(husk at omdøbe alle Tryk til EKG)
Tryk- og EKG-plottet har, efter peak-detektionen, fået slettet sin tids-information, så X-aksen nu er antal samples, ikke tid. Dette skal nu konverteres tilbage til tid i sekunder ved at dividere med 200 Hz, samplings-raten fra DAQ-assistenten.
- Divider Locations udgangen fra Peak Detectoren med 200
- Lav en unbundle på udgangen fra XY-data sub-VI'et og divider øverste signal med 200. Samle begge signaler igen i et med bundle. Se nærmere herunder:
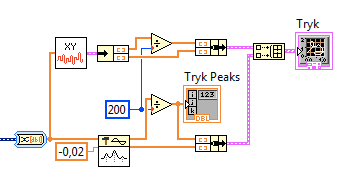
Vi er nu næsten i hus. Sidste punkt er at trække Tryk Peaks fra EKG Peaks og midle differencen, samt udregne PWV ved at kunne indtaste distancen fra fossa jugularis til a. radialis målestedet:
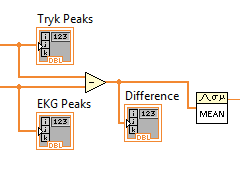
- Indsæt en minus funktion og forbind data, der går ind i Tryk Peaks Arrayet med øverste indgang.
- Forbind data til EKG arrayet med nederste indgang.
- Skab et Indikator Array ved at højreklikke udgangen af divisions funktionen og vælge Create -> Indicator. Omdøb det til Difference
- Indsæt en "Mean" funktion
- Mathematics -> Prob & Stat -> Mean
- Forbind den med indgangen til Difference arrayet
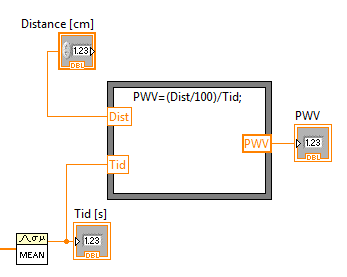
- Indsæt en numerisk kontrol på front panelet og omdøb den til Distance.
- Indsæt en formel for udregning af PWV = (Distance/100) / Tid
- Forbind PWV udgangen til en numerisk indikator og omdøb den til PWV.
- Kør dit VI og tjek om de fundne peaks ser rimelige ud, og at det hele virker.
- Gem dit VI som 6_PWV_Analyse.vi
