Introduction:
In this exercise, you will connect a Strain Gauge Half-Bridge with your DAQ and develop a little scale. The half-bridge consists of a square metal beam with two strain gauges attached, one on each side. When you apply a load to the metal bar, the resistance of the two strain gauges changes - this change can be converted to the weight of the applied load.
 Theory:
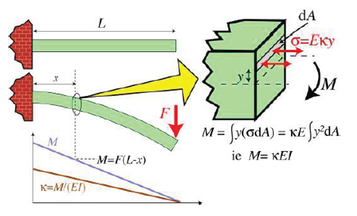
The two Strain Gauges are glued to the top and bottom of the beam. When a load is applied at the end, the bottom will be compressed while the top will be stretched. The strain gauges have the property, that compression/tension will change their resistivity due to changes in length and thickness. When these variable resistances are part of a so-called Wheatstone Bridge, the changes in resistance are converted to a voltage. For a half-bridge, there are two possible configurations; One with one strain gauge oriented parallel to the length of the beam and the other rotated 90° oriented transversely (to measure changes in Poisson's ratio). The one you will be using (in LabView language: A Half-bridge II), where both strain gauges are oriented parallel to the beam. The reason for using two strain gauges is the increase the sensitivity of the bridge. On a full-bridge, four strain gauges are used in total a transverse and parallel on both top and bottom.
You can find further details in this pdf-document.
Setup:
Materials:
- Strain Gauge Half-Bridge
- Amplifier for the bridge
- Weights
- 4 cables with banana-plugs (male-male)
- Cable: BNC -> 2 naked wires
- 1 DAQ (NI-6009)
Instructions:
The amplifier has to be connected to +15V, -15V and ground. Turn off both circuits (the small buttons besides the positive terminals) before connecting the cables, and adjust the current to 15.0 V on both circuits. Set Current to 0.05 A on both circuits.
Control that everything is set up correctly - please ask for help if you are in doubt - you can easily burn the amplifiers with wrongly connected wires or incorrect voltage/current settings.
Attach the cables as shown below:
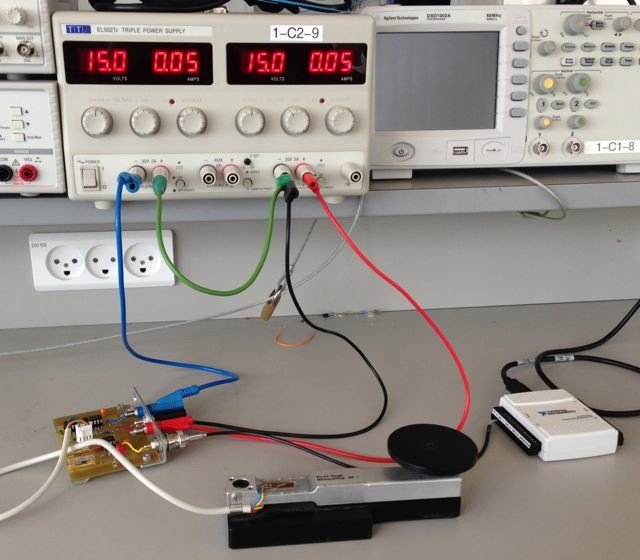
Connect the Strain Gauge Half-Bridge with the amplifier using the white plug and attach the BNC cable to the BNC exit. Connect the naked wires from here with the DAQ on input AI0 ± (it doesn't matter which cable you attach where - you will either have ).
Attach your DAQ to the computer's USB plug. You are now ready for the exercise proper.
VI implementation:
Your VI has to calibrate your Half-Bridge, so voltage is converted directly to gram. For this, an array is used, containing the calibration weights in the first column and the corresponding voltage in the second. To fill the second column with the voltages, you will use a Text Ring control, which can yield both a text-string as well as it's corresponding value. The values and weights are fed into a linear fit function, which yields the slope and intercept with the y-axis. If slope is multiplied with the voltage and the intercept is added, the voltage will be converted directly to gram, and weight is finished.
- Start LabView and create an empty VI.
- Insert a DAQ assistant on the Block Diagram
- Acquire Signal -> Analog Input -> Strain
- If you do not have the DAQ assistant, you need to install the device drivers, present in the studapps folder
- Choose the 6009 module and input ai0 (analog input 0)
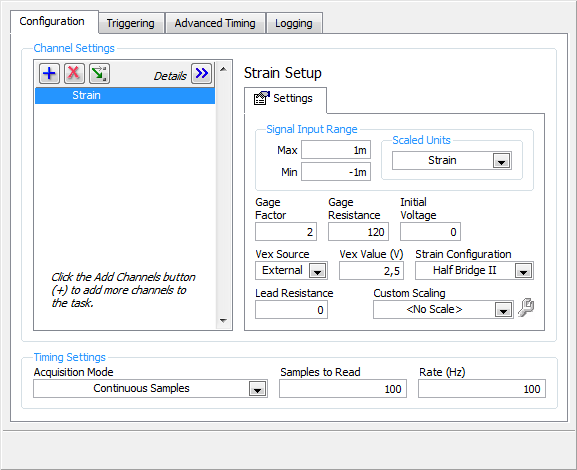
- Under "Strain Configuration", choose "Half Bridge II".
- Set Gage Resistance to 120.
- Set Acquisition mode (at the bottom) to Continuous Samples and Samples to Read to 10 and Rate (Hz) to 100.
- Your panel should look like this:
- When you click OK, LabView will ask if you wish to insert a While loop. Answer yes.
- Connect a Waveform Graph to the Data output (place the graph inside the While loop).
- Also create a numeric indicator and wire it to the Data output, so that the value can be read numerically.
- Run your VI (not continuously), and try loading the Half-bridge, to see whether the load is reflected in the graph.
- Now you need to calibrate the Half-Bridge. Firstly, the voltages from a range of known weights need to be saved. They will be used to calculate the linear relationship between voltage and weight.
- Start be creating a control array on the Front Panel, containing numeric controls. Make it four rows and two columns.
- Fill the first column with the values 0, 100, 500, and 2000 (these are the weights, which will be used to calibrate), the second column is left with zeros (the voltage for each weight will be inserted here).
- To active this column you MUST enter 0 in one of the cells and hitting enter - this should make the column go from toned down gray to white and be active.
- Right-click the border of the Control Array and choose Data Operations -> Make Current Value Default
- This will save the entered values, so that the array always will begin using these values (instead of zero across the line - which would be the result of using "Initialize Array").
- Rename your Control Array to "Weight/Voltage Initialization".
- Duplicate your Control Array (Ctri+C, deselect everything and hit Ctrl+V). Right-click this new array and choose "Change to Indicator". Rename the new array "Weight/Voltage).
- Place the icon for the initialization array on the Block Diagram to the left of the While Loop. Hide the array, so that it will be invisible on the Front Panel by right-clicking the icon on the Block Diagram and choosing "Hide Control".
- Draw the value from the Array into the While Loop, and remember to connect it using a structure allowing you to update the array without resetting at each iteration.
 Now you will create a structure, allowing you to save a certain voltage when you weigh a weight. For this, you will need a "Text Ring" control. This is a structure, allowing you to create texts, which have a value attached. We will use this to save e.g. the voltage for 100g on place number 1 in the array.
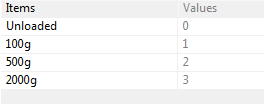 Create a "Text Ring" control on the Front Panel and rename it "CalibrationText"
- Right-click it, and choose "Edit items"
- Edit the values to look like those on the right.
- This now forms a look-up table, so that you know, that if a voltage for e.g. 2000g has to be saved, this should take place in position 3 of the array.
- Add a Boolean Button, and rename it "Calibrate Weight".
This button only has to activate once, when you click it, thus it is not supposed to remain depressed. To can change from the permanent state (Switch) into a single pressure (Latch) by right-clicking the button and choose "Mechanical Action". - Create a Case structure inside the While Loop - under True, it must accept the value from the Data output of the DAQ Assistant and save it in the Weight/Voltage Initialization Array at the right position. Under false, the array has to pass unchanged from left to right.
- Connect the array from the Case structure with your Weight/Voltage Indicator Array.
- If all is well, you should now be able to weigh different weights and save the voltages on the right places in the array. Test this.
- Rather than having to weigh every weight each time you add new functions, it is a VERY good idea, to program the option of saving your calibration and reading it at the beginning (you may - correctly - read this to indicate, that this possibility did not occur to the teacher before COUNTLESS calibrations…)
- Create another Boolean Control button (Mechanical Action = Latch) and rename it "Save Calibration". Connect it to a Case Structure, into which you will insert a "Write To Measurement File". Make it save the calibration somewhere logical and name it e.g. HalfBridgeCalibration.lvm
- Connect the Array with the Signals output.
- To the left of the While Loop, you will create a new Case structure. In the True case, it will read your saved LVM file and send it to the While Loop as the default input. Under False, it will use the earlier "Weight/Voltage Initialization array". Connect the Selector Terminal with a Boolean Button (Mechanical Action = Switch) and name this one "Read Calibration".
- Depenging on whether you set "Read Calibration" to True before starting your VI, you can now either calibrate one more, or use your save calibration instead.
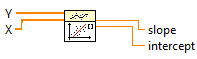 Now we are ready to calculate the linear relationship between voltage and weight. For this purpose you will use the appropriately named "Linear Fit" LabvView VI (NB: NOT Linear Fit PtByPt!) The relevant in- and outputs are shown to the right
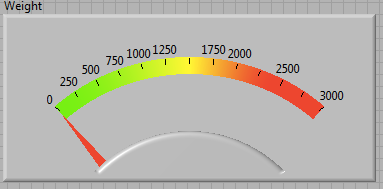 Wire Weights to the Y-input (use your newly create "Select Column" SubVI from the last lecture) and Voltage to the X-input.
- Create numeric indicators for Slope and Intercept
- Multiply Slope onto the Voltage from the DAQ Assistant and add the Intercept value. Connect the result of the calculation with a Meter Numeric Indicator (like the one to the right), and change the scale to go from 0->3000. Enlarge it and rename it Weight.
- If all is well, you can now place random weights on the Half Bridge and weigh them with a certain precision:)
- Save your VI as "4.1 - HalfBridgeWeight.vi"