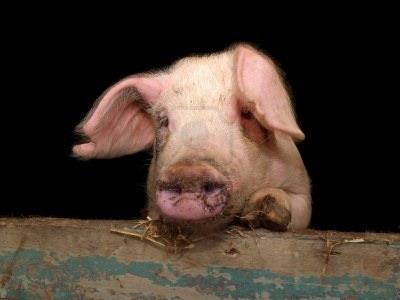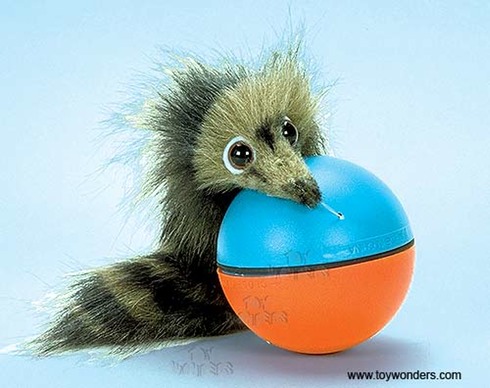
In this exercise, you will create a VI for monitoring the position of pigs, stabled in pigsties at Påskehøjgård, a facility for stabling pigs scheduled for research at Aarhus University Hospital Skejby.
The facility would like the option to monitor the health of the pigs remotely in a cost-effective manner. To aid this, you will create VI's for tracking the position of pigs in different zones. Pigs are apparently very structured animals, having an area set aside for sleeping, one for eating, another for play, and yet another for - well - shitting.
In our model of a pigsty, you will be given a white box in which you will place a "WeazelBall". When switched on, the ball will move around in the box. The aim is for you to track the ball using an overhead USB webcam, and record the position as a function of time. Finally, you should output the percentage of the monitored time spent in each area.

Thus, you will create a VI, which has to:
- Segment the WeazelBall
- Record the position
- Determine the current zone and record it for later analysis
- The easiest way to do this, is to divide the box into quadrants and determine which quadrant the "pig" is in
- A better way would be for you to allow the operator to draw user-defined areas of interest or zones on the pigsty image and record the time spent in each of these. Try implementing this, if you have the time.
- Present the time spent in each zone
You are free to construct the VI any way you wish. Have fun!